CS-4125 ML
Lecture 18: Application Example - Photo OCR
An in-depth case study on building a Photo Optical Character Recognition (Photo OCR) system, covering machine learning pipelines, sliding window classifiers, artificial data synthesis, and ceiling analysis.
Problem Description and Pipeline
- Case study focused around photo OCR
- Three reasons to do this:
- Look at how a complex system can be put together
- The idea of a machine learning pipeline
- What to do next
- How to do it
- Some more interesting ideas
- Applying machine learning to tangible problems
- Artificial data synthesis
What is the Photo OCR Problem?
- Photo OCR = photo optical character recognition
- With growth of digital photography, lots of digital pictures
- One idea which has interested many people is getting computers to understand those photos
- The photo OCR problem is getting computers to read text in an image
- Possible applications for this would include:
- Make searching easier (e.g. searching for photos based on words in them)
- Car navigation
- Possible applications for this would include:
- OCR of documents is a comparatively easy problem
- From photos it's really hard
OCR Pipeline
-
- Look through image and find text
-
- Do character segmentation
-
- Do character classification
-
- Optional: some may do spell check after this too
- We're not focussing on such systems though

- Pipelines are common in machine learning
- Separate modules which may each be a machine learning component or data processing component
- If you're designing a machine learning system, pipeline design is one of the most important questions
- Performance of pipeline and each module often has a big impact on the overall performance of a problem
- You would often have different engineers working on each module
- Offers a natural way to divide up the workload
Sliding Window Image Analysis
- How do the individual models work?
- Here focus on a sliding windows classifier
- As mentioned, stage 1 is text detection
- Unusual problem in computer vision - different rectangles (which surround text) may have different aspect ratios (aspect ratio being height : width)
- Text may be short (few words) or long (many words)
- Tall or short font
- Text might be straight on
- Slanted
- Unusual problem in computer vision - different rectangles (which surround text) may have different aspect ratios (aspect ratio being height : width)
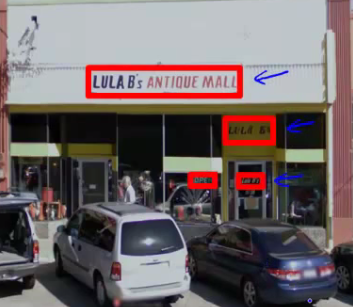
- Let's start with a simpler example
Pedestrian Detection
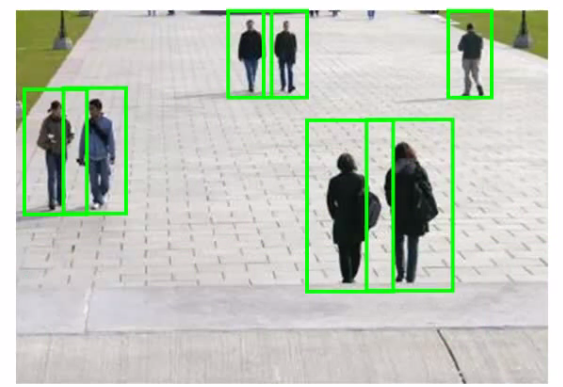
- Want to take an image and find pedestrians in the image
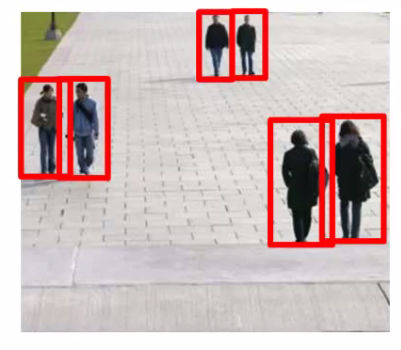
- This is a slightly simpler problem because the aspect ratio remains pretty constant
- Building our detection system:
- Have aspect ratio
- This is a typical aspect ratio for a standing human
- Collect training set of positive and negative examples
- Have aspect ratio
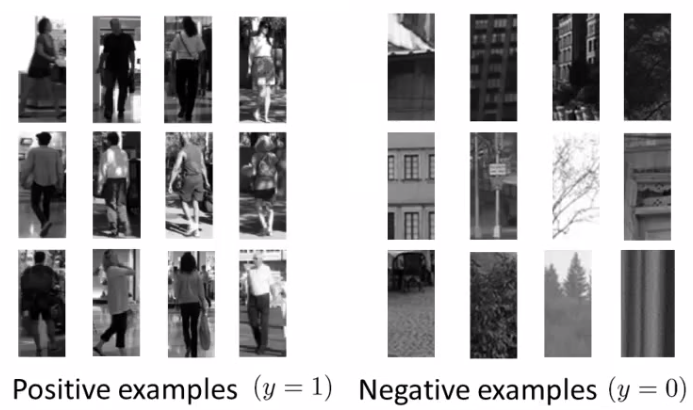
- Could have 1,000 – 10,000 training examples
- Train a neural network to take an image patch and classify that image as pedestrian or not
- Gives you a way to train your system
- Now we have a new image - how do we find pedestrians in it?
- Start by taking a rectangular patch in the image
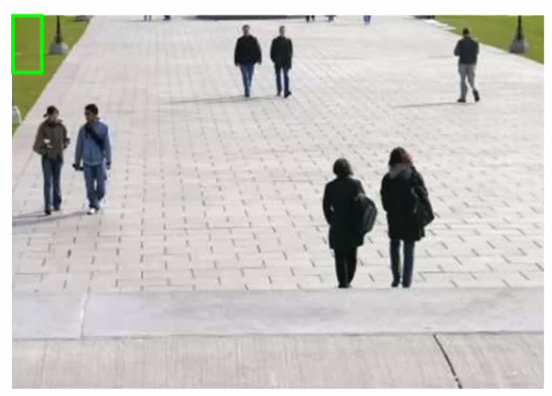
- Run patch through classifier - hopefully in this example it will return
- Next slide the rectangle over to the right a little bit and re-run
- Then slide again
- The amount you slide each rectangle over is a parameter called the step-size or stride
- Could use 1 pixel
- Best, but computationally expensive
- More commonly 5–8 pixels used
- Could use 1 pixel
- So, keep stepping rectangle along all the way to the right
- Eventually get to the end
- Then move back to the left hand side but step down a bit too
- Repeat until you've covered the whole image
- Now, we initially started with quite a small rectangle
- So now we can take a larger image patch (of the same aspect ratio)
- Each time we process the image patch, we're resizing the larger patch to a smaller image, then running that smaller image through the classifier
- Hopefully, by changing the patch size and rastering repeatedly across the image, you eventually recognize all the pedestrians in the picture
Text Detection Example
- Like pedestrian detection, we generate a labeled training set with:
- Positive examples (some kind of text)
- Negative examples (not text)
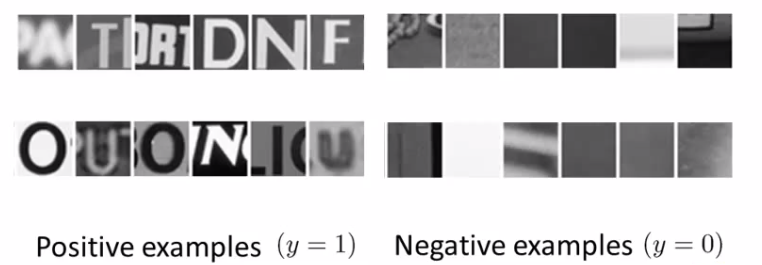
- Having trained the classifier we apply it to an image
- So, run a sliding window classifier at a fixed rectangle size
- If you do that end up with something like this
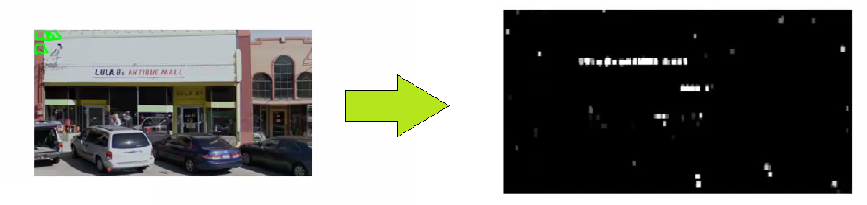
- White region show where text detection system thinks text is
- Different shades of gray correspond to probability associated with how sure the classifier is the section contains text
- Black - no text
- White - text
- For text detection, we want to draw rectangles around all the regions where there is text in the image
- Different shades of gray correspond to probability associated with how sure the classifier is the section contains text
- Take classifier output and apply an expansion algorithm
- Takes each of white regions and expands it
- How do we implement this?
- Say, for every pixel, is it within some distance of a white pixel?
- If yes then colour it white
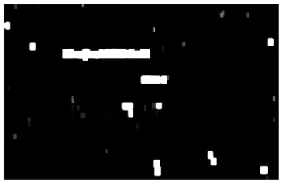
- Look at connected white regions in the image above
- Draw rectangles around those which make sense as text (i.e. tall thin boxes don't make sense)
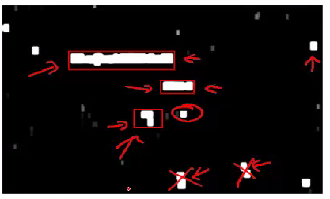
- This example misses a piece of text on the door because the aspect ratio is wrong
- Very hard to read
Stage Two: Character Segmentation
- Use supervised learning algorithm
- Look in a defined image patch and decide, is there a split between two characters?
- So, for example, our first training data item below looks like there is such a split
- Similarly, the negative examples are either empty or hold full characters
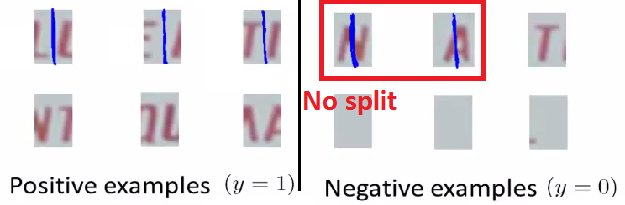
- We train a classifier to try and classify between positive and negative examples
- Run that classifier on the regions detected as containing text in the previous section
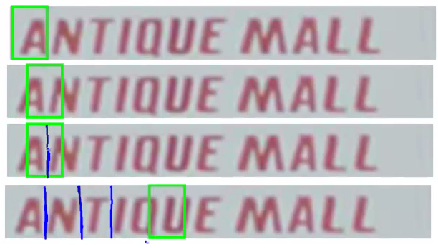
- Use a 1-dimensional sliding window to move along text regions
- Does each window snapshot look like the split between two characters?
- If yes insert a split
- If not move on
- So we have something that looks like this
- Does each window snapshot look like the split between two characters?
Character Classification
- Standard OCR, where you apply standard supervised learning which takes an input and identify which character we decide it is
- Multi-class characterization problem
Getting Lots of Data: Artificial Data Synthesis
- We've seen over and over that one of the most reliable ways to get a high performance machine learning system is to take a low bias algorithm and train on a massive data set
- Where do we get so much data from?
- In ML we can do artificial data synthesis
- This doesn't apply to every problem
- If it applies to your problem, it can be a great way to generate loads of data
- Two main principles:
- Creating data from scratch
- If we already have a small labeled training set can we amplify it into a larger training set
Character Recognition as an Example of Data Synthesis
- If we go and collect a large labeled data set will look like this
- The goal is to take an image patch and have the system recognize the character
- Let's treat the images as gray-scale (makes it a bit easier)
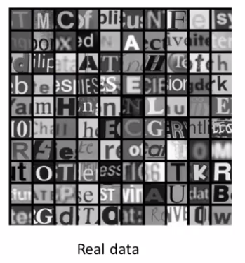
- How can we amplify this?
- Modern computers often have a big font library
- If you go to websites, huge free font libraries
- For more training data, take characters from different fonts, paste these characters against random backgrounds
- After some work, can build a synthetic training set
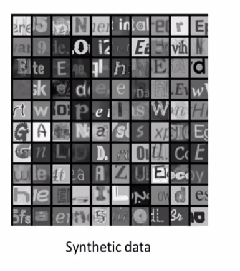
- Random background
- Maybe some blurring/distortion filters
- Takes thought and work to make it look realistic
- If you do a sloppy job this won't help!
- So unlimited supply of training examples
- This is an example of creating new data from scratch
- Other way is to introduce distortion into existing data
- e.g. take a character and warp it
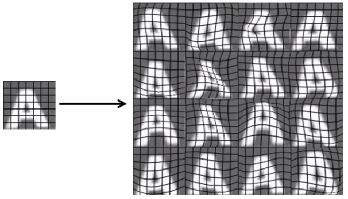
- 16 new examples
- Allows you to amplify existing training set
- This, again, takes thought and insight in terms of deciding how to amplify
Another Example: Speech Recognition
- Learn from audio clip - what were the words
- Have a labeled training example
- Introduce audio distortions into the examples
- So only took one example
- Created lots of new ones!
- When introducing distortion, they should be reasonable relative to the issues your classifier may encounter
Getting More Data
- Before creating new data, make sure you have a low bias classifier
- Plot learning curve
- If not a low bias classifier increase number of features
- Then create large artificial training set
- Very important question: How much work would it be to get 10x data as we currently have?
- Often the answer is, "Not that hard"
- This is often a huge way to improve an algorithm
- Good question to ask yourself or ask the team
- How many minutes/hours does it take to get a certain number of examples
- Say we have 1,000 examples
- 10 seconds to label an example
- So we need another 9,000 - 90,000 seconds
- Comes to a few days (25 hours!)
- Crowd sourcing is also a good way to get data
- Risk or reliability issues
- Cost
- Example: Amazon mechanical turks
Ceiling Analysis: What Part of the Pipeline to Work on Next
- Through the course repeatedly said one of the most valuable resources is developer time
- Pick the right thing for you and your team to work on
- Avoid spending a lot of time to realize the work was pointless in terms of enhancing performance
Photo OCR Pipeline
- Three modules
- Each one could have a small team on it
- Where should you allocate resources?
- Good to have a single real number as an evaluation metric
- So, character accuracy for this example
- Find that our test set has 72% accuracy
Ceiling Analysis on Our Pipeline
- We go to the first module
- Mess around with the test set - manually tell the algorithm where the text is
- Simulate if your text detection system was 100% accurate
- So we're feeding the character segmentation module with 100% accurate data now
- How does this change the accuracy of the overall system?

- Accuracy goes up to 89%
- Next do the same for the character segmentation
- Accuracy goes up to 90% now
- Finally do the same for character recognition
- Goes up to 100%
- Having done this we can qualitatively show what the upside to improving each module would be
- Perfect text detection improves accuracy by 17%!
- Would bring the biggest gain if we could improve
- Perfect character segmentation would improve it by 1%
- Not worth working on
- Perfect character recognition would improve it by 10%
- Might be worth working on, depends if it looks easy or not
- Perfect text detection improves accuracy by 17%!
- The "ceiling" is that each module has a ceiling by which making it perfect would improve the system overall
Other Example: Face Recognition
- NB this is not how it's done in practice
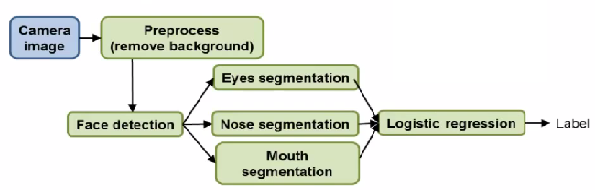
- Probably more complicated than is used in practice
- How would you do ceiling analysis for this:
- Overall system is 85%
-
- Perfect background -> 85.1%
- Not a crucial step
-
- Perfect face detection -> 91%
- Most important module to focus on
-
- Perfect eyes -> 95%
-
- Perfect nose -> 96%
-
- Perfect mouth -> 97%
-
- Perfect logistic regression -> 100%
- Cautionary tale:
- Two engineers spent 18 months improving background pre-processing
- Turns out had no impact on overall performance
- Could have saved three years of man power if they'd done ceiling analysis
- Two engineers spent 18 months improving background pre-processing
Lecture 17: Large Scale Machine Learning
An in-depth guide to scaling machine learning algorithms for large datasets using Stochastic Gradient Descent, Mini-Batch Gradient Descent, Online Learning, and MapReduce.
Lecture 19: Course Summary
A comprehensive summary and overview of all key topics covered throughout the machine learning course, including supervised learning, unsupervised learning, special applications, and advice on building machine learning systems.