CS-4125 ML
Lecture 11: Machine Learning System Design
A comprehensive guide to machine learning system design, including prioritization, error analysis, handling skewed classes with precision/recall and F1 score, and analyzing data requirements.
Machine Learning System Design
- In this section we'll touch on how to put together a system.
- Previous sections have looked at a wide range of different issues in significant focus.
- This section is less mathematical, but the material will be very useful nonetheless.
- Consider the system approach.
- You can understand all the algorithms, but if you don't understand how to make them work in a complete system, that's no good!
Prioritizing What to Work On: Spam Classification Example
- The idea of prioritizing what to work on is perhaps the most important skill programmers typically need to develop.
- It's so easy to have many ideas you want to work on, and as a result do none of them well, because doing one well is harder than doing six superficially.
- So you need to make sure you complete projects.
- Get something "shipped" — even if it doesn't have all the bells and whistles, that final 20% getting it ready is often the toughest.
- If you only release when you're totally happy, you rarely get practice doing that final 20%.
- So, back to machine learning...
- It's so easy to have many ideas you want to work on, and as a result do none of them well, because doing one well is harder than doing six superficially.
- Building a spam classifier.
- Spam is email advertising:

- What kind of features might we define?
- Spam ():
- Misspelled word
- Not spam ():
- Real content
- Spam ():
- How do we build a classifier to distinguish between the two?
- Feature representation:
- How do we represent (features of the email)?
- or
- How do we represent (features of the email)?
- Feature representation:
One Approach: Choosing Your Own Features
- Choose 100 words which are indicative of an email being spam or not spam.
- Spam e.g., buy, discount, deal
- Non-spam Andrew, now
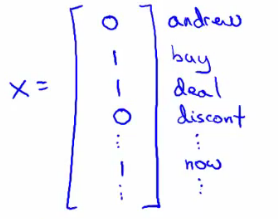
- All these words go into one long vector.
- Encode this into a reference vector:
- See which words appear in a message.
- Define a feature vector :
- Which is 0 or 1 depending on whether a corresponding word in the reference vector is present or not.
- This is a bitmap of the word content of your email.
- i.e., don't recount if a word appears more than once.
- Which is 0 or 1 depending on whether a corresponding word in the reference vector is present or not.
- In practice, it's more common to have a training set and pick the most frequent words, where is 10,000 to 50,000.
- So here you're not specifically choosing your own features, but you are choosing how you select them from the training set data.
What's the Best Use of Your Time to Improve System Accuracy?
- Natural inclination is to collect lots of data.
- Honey pot anti-spam projects try to get fake email addresses into spammers' hands and collect loads of spam.
- This doesn't always help though.
- Develop sophisticated features based on email routing information (contained in email header).
- Spammers often try to obscure origins of email.
- Send through unusual routes.
- Develop sophisticated features for message body analysis.
- Discount == discounts?
- DEAL == deal?
- Develop sophisticated algorithm to detect misspelling.
- Spammers use misspelled words to get around detection systems.
- Often a research group randomly focuses on one option.
- May not be the most fruitful way to spend your time.
- If you brainstorm a set of options this is really good.
- Very tempting to just try something.
Error Analysis
- When faced with an ML problem, there are lots of ideas of how to improve performance.
- Talk about error analysis — how to better make decisions.
- If you're building a machine learning system, it's often good to start by building a simple algorithm which you can implement quickly.
- Spend at most 24 hours developing an initially bootstrapped algorithm.
- Implement and test on cross-validation data.
- Plot learning curves to decide if more data, features, etc., will help algorithmic optimization.
- Hard to tell in advance what is important.
- Learning curves really help with this.
- A way of avoiding premature optimization.
- We should let evidence guide decision making regarding development trajectory.
- Error analysis:
- Manually examine the samples (in cross-validation set) that your algorithm made errors on.
- See if you can work out why.
- Systematic patterns — help design new features to avoid these shortcomings.
- Example:
- Built a spam classifier with 500 examples in CV set.
- Here, error rate is high — gets 100 wrong.
- Manually look at 100 and categorize them depending on features.
- e.g., type of email.
- Looking at those emails:
- May find most common type of spam emails are pharmacy emails, phishing emails.
- See which type is most common — focus your work on those ones.
- What features would have helped classify them correctly?
- e.g., deliberate misspelling
- Unusual email routing
- Unusual punctuation
- May find some "spammer technique" is causing a lot of your misses.
- Guide a way around it.
- May find most common type of spam emails are pharmacy emails, phishing emails.
- Built a spam classifier with 500 examples in CV set.
- Spend at most 24 hours developing an initially bootstrapped algorithm.
- Importance of numerical evaluation:
- Have a way of numerically evaluating the algorithm.
- If you're developing an algorithm, it's really good to have some performance calculation which gives a single real number to tell you how well it's doing.
- Example:
- Say we're deciding if we should treat a set of similar words as the same word.
- This is done by stemming in NLP (e.g., "Porter stemmer" looks at the etymological stem of a word).
- This may make your algorithm better or worse.
- Also worth considering weighting error (false positive vs. false negative).
- e.g., is a false positive really bad, or is it worth having a few of one to improve performance a lot?
- Also worth considering weighting error (false positive vs. false negative).
- Can use numerical evaluation to compare the changes.
- See if a change improves an algorithm or not.
- A single real number may be hard/complicated to compute, but makes it much easier to evaluate how changes impact your algorithm.
- You should do error analysis on the cross-validation set instead of the test set.
Error Metrics for Skewed Classes
- One case where it's hard to come up with a good error metric is skewed classes.
- Example:
- Cancer classification:
- Train logistic regression model where:
- Cancer means
- Otherwise
- Test classifier on test set:
- Get 1% error.
- So this looks pretty good...
- But only 0.5% of patients have cancer.
- Now, 1% error looks very bad! (A dummy classifier predicting for everything would get 0.5% error).
- Get 1% error.
- Train logistic regression model where:
- So when the number of examples of one class is very small, this is an example of skewed classes:
- LOTS more of one class than another.
- So standard error metrics (like raw accuracy/error rate) aren't so good.
- Cancer classification:
- Another example:
- Algorithm has 99.2% accuracy.
- Make a change, now get 99.5% accuracy.
- Does this really represent an improvement to the algorithm?
- Did we do something useful, or did we just create something which predicts more often?
- Get very low error, but classifier is still not great.
Precision and Recall
- Two new metrics: precision and recall.
- Both give a value between 0 and 1.
- Evaluating classifier on a test set:
- For a test set, the actual class is 1 or 0.
- Algorithm predicts some value for class, predicting a value for each example in the test set.
- Considering this, classification outcomes can be:
- True positive (we guessed 1, it was 1)
- False positive (we guessed 1, it was 0)
- True negative (we guessed 0, it was 0)
- False negative (we guessed 0, it was 1)
- Precision:
- How often does our algorithm cause a false alarm?
- Of all patients we predicted have cancer, what fraction of them actually have cancer?
- High precision is good (i.e., closer to 1).
- You want a big number, because you want false positives to be as close to 0 as possible.
- Recall:
- How sensitive is our algorithm?
- Of all patients in the set that actually have cancer, what fraction did we correctly detect?
- High recall is good (i.e., closer to 1).
- You want a big number, because you want false negatives to be as close to 0 as possible.
- By computing precision and recall, we get a better sense of how an algorithm is doing.
- This can't really be gamed.
- Means we're much more sure that an algorithm is good.
- Typically, we say the presence of a rare class is what we're trying to determine (e.g., positive (1) is the existence of the rare thing).
Trading Off Precision and Recall
- For many applications, we want to control the trade-off between precision and recall.
- Example:
- Trained a logistic regression classifier:
- Predict 1 if
- Predict 0 if
- This classifier may give some value for precision and some value for recall.
- Suppose we want to predict 1 only if very confident:
- One way to do this is to modify the prediction threshold:
- Predict 1 if
- Predict 0 if
- Now we can be more confident that a predicted 1 is a true positive.
- But classifier has lower recall — predict for a smaller number of patients.
- Risk of higher false negatives.
- One way to do this is to modify the prediction threshold:
- Another example — avoid false negatives (missing cancer):
- Missing a cancer diagnosis is dangerous, so we set a lower threshold:
- Predict 1 if
- Predict 0 if
- i.e., predict cancer if there is even a 30% chance they have cancer.
- So now we have a higher recall, but lower precision.
- Risk of more false positives, because we're less discriminating in deciding who has cancer.
- Missing a cancer diagnosis is dangerous, so we set a lower threshold:
- Trained a logistic regression classifier:
- This threshold defines the trade-off:
- We can show this graphically by plotting precision vs. recall:
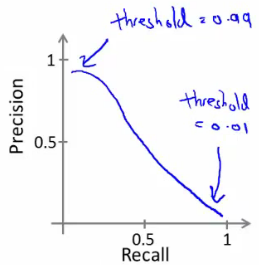
- This curve can take many different shapes depending on classifier details.
- Is there a way to automatically choose the threshold?
- Or, if we have a few algorithms, how do we compare different algorithms or parameter sets?
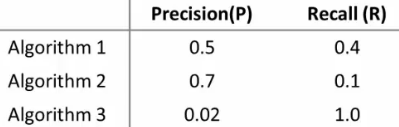
- How do we decide which of these algorithms is best?
- We spoke previously about using a single real number evaluation metric.
- By switching to precision/recall, we have two numbers.
- Now comparison becomes harder.
- Better to have just one number.
- How can we convert Precision & Recall into one number?
- One option is the average:
- This is not such a good solution.
- Means if we have a classifier which predicts all the time, you get a high recall and low precision.
- Similarly, if we predict rarely, we get high precision and low recall.
- So averages here would be 0.45, 0.4, and 0.51.
- 0.51 is ranked best by average, despite having a recall of 1 (predicting for everything).
- So average isn't great.
- Score (-score):
- score is like taking the average of precision and recall, giving a higher weight to the lower value.
- Many formulas for computing comparable precision/accuracy values:
- If or , then .
- If and , then .
- The remaining values lie between 0 and 1.
- One option is the average:
- Threshold offers a way to control the trade-off between precision and recall.
- score gives a single real number evaluation metric.
- If you're trying to automatically set the threshold, one way is to try a range of threshold values and evaluate them on your cross-validation set.
- Then pick the threshold which gives the best score.
- If you're trying to automatically set the threshold, one way is to try a range of threshold values and evaluate them on your cross-validation set.
Data for Machine Learning
- Now switch tracks and look at how much data to train on.
- In early videos, we cautioned against blindly getting more data.
- Turns out under certain conditions, getting more data is a very effective way to improve performance.
Designing a High Accuracy Learning System
- There have been studies of using different algorithms on data:
- Problem: Disambiguating confusing words in context (e.g., "two", "to", or "too").
- Algorithms:
- Perceptron (logistic regression)
- Winnow (like logistic regression, used less now)
- Memory-based (used less now, talk about this later)
- Naive Bayes (cover later)
- Varied training set size and tried algorithms on a range of sizes:
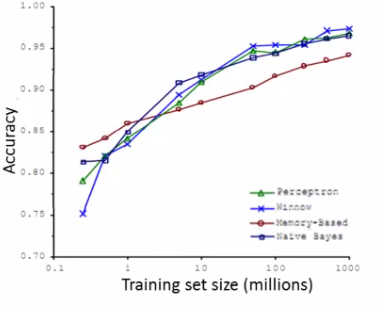
- What can we conclude?
- Algorithms give remarkably similar performance.
- As training set size increases, accuracy increases.
- Take an algorithm, give it more data, and it should beat a "better" algorithm trained on less data.
- Shows that:
- Algorithm choice yields pretty similar results.
- More data helps significantly.
- When is this true and when is it not?
- If we can correctly assume that features have enough information to predict accurately, then more data will probably help.
- A useful test to determine if this is true: "Given , can a human expert predict ?"
- Suppose we use a learning algorithm with many parameters, such as logistic regression or linear regression with many features, or neural networks with many hidden units:
- These are powerful learning algorithms with many parameters which can fit complex functions.
- Such algorithms are low bias algorithms.
- Little systematic bias in their representation — highly flexible.
- Such algorithms are low bias algorithms.
- Use a small training set:
- Training error should be small.
- Use a very large training set:
- If the training set error is close to the test set error, it is unlikely to overfit with our complex algorithms.
- So the test set error should also be small.
- These are powerful learning algorithms with many parameters which can fit complex functions.
- Another way to think about this is we want our algorithm to have low bias and low variance:
- Low bias use complex algorithm (many parameters/features).
- Low variance use large training set.
- If we can correctly assume that features have enough information to predict accurately, then more data will probably help.
Lecture 10: Advice for Applying Machine Learning
Practical advice and diagnostic techniques for evaluating and improving machine learning algorithms, including train/validation/test splits, bias vs. variance analysis, regularization tuning, and learning curves.
Lecture 12: Support Vector Machines
A comprehensive guide to Support Vector Machines (SVMs), including optimization objectives, large margin classification intuition and mathematics, kernel methods, and practical implementation advice.