2024 Final Examination (27th Batch)
4th Year 1st Semester Final Examination, 2024 - Questions and Step-by-Step Solutions
Question 1
1 (a) What is a heuristic and what does it mean for it to be admissible? List two examples of typical heuristic functions. Show that if a heuristic is consistent it must be admissible. [4]
Heuristic Functions and Optimality
1 (b) Explain what A* search is, including the advantages and disadvantages with respect to its theoretical properties. [4]
1 (c) Show all possible moves from initial to goal for the following 8-puzzle problem with path cost 1 for each level and number of misplaced tiles as the heuristic. [6]
| 2 | 8 | 3 |
| 1 | 6 | 4 |
| 7 | - | 5 |
| 1 | 2 | 3 |
| 8 | - | 4 |
| 7 | 6 | 5 |
Informed Search and Heuristics
Question 2
2 (a) Consider the following statements.
- Everyone who loves all animals is loved by someone.
- Anyone who kills an animal is loved by no one.
- Jack loves all animals.
- Either Jack or Curiosity killed the cat, who is named Tuna.
Now, you need to use all the steps of the resolution inference process to prove whether the following statement is true or not: "Jack killed the cat". To make it easier for you, we express the original sentences, some background knowledge and the negated goal in the first order predicate logic. You have to explicitly show the CNF version of the problem and then show the resolution graph. [9]
A.
B.
C.
D.
E.
F.
.
2 (b)
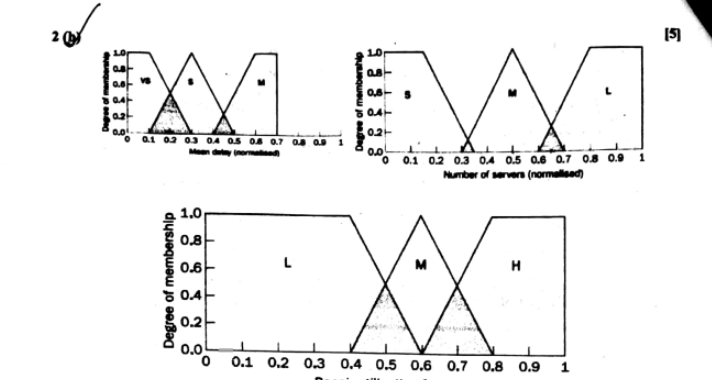
- The top-left graph represents the fuzzy sets for mean delay, defined over a normalized scale from 0 to 1. It includes three linguistic categories: Very Small (VS), Small (S), and Medium (M), each represented by overlapping triangular functions to capture gradual transitions in delay perception.
- The top-right graph shows the fuzzy sets for the number of servers, again normalized, with categories Small (S), Medium (M), and Large (L). This graph also uses triangular membership functions that allow partial membership across categories for intermediate values.
- The bottom graph illustrates the fuzzy sets for the repair utilization factor, categorized into Low (L), Medium (M), and High (H).
Rule 1: If Mean Delay is Very Small and Number of Servers is Large, then Utilization is Low Rule 2: If Mean Delay is Small and Number of Servers is Medium, then Utilization is Medium Rule 3: If Mean Delay is Medium and Number of Servers is Small, then Utilization is High Rule 4: If Mean Delay is Small and Number of Servers is Small, then Utilization is High Rule 5: If Mean Delay is Medium and Number of Servers is Medium, then Utilization is Medium
Use the fuzzy inference process to determine the precise value of the repair utilization factor if the mean delay is 0.25 and the number of servers is 0.65. You must show all the steps in doing so. [5]
Question 3
3 (a) The 4-Queens problem is a classical combinatorial problem in which the objective is to place four queens on a chessboard such that no two queens threaten each other. This means that no two queens can be placed in the same row, column, or diagonal. The problem can be represented as a set of variables where each variable corresponds to a column on the board, and the domain of each variable is the set , representing the possible row positions for a queen in that column.
You are required to solve this problem using Forward Checking combined with Backtracking. Clearly show the assignments made to each variable, the updated domains after each step, and any domain reductions that occur. If backtracking is needed at any point, identify when and why it happens. In particular, explain under what condition forward checking triggers backtracking during the search process. Finally, provide the complete solution(s) that satisfy all constraints. [8]
Backtracking and Local Search for CSPs
3 (b) i. Explain why it is a good heuristic to choose the variable that is most constrained but the value that is least constraining in a CSP search. [3+3]
ii. In the context of solving Constraint Satisfaction Problems (CSPs), scalability becomes increasingly challenging as the size and complexity of the problem grow. Explain how heuristic strategies can improve the efficiency and scalability of a backtracking-based CSP algorithm. Additionally, discuss how scalability can be enhanced at the expense of exactness by using approximate solutions.
Constraint Satisfaction Problems
Question 4
4 (a)
| 0.6 | |||
| 0.4 | |||
| 0.2 | |||
| 0.8 | |||
| 0.7 | |||
| 0.3 | |||
| 0.1 | |||
| 0.9 |
| 1.2 | |
| 2.5 |
A robot operates in a simple environment modeled as a Markov Decision Process (MDP) with two states and two actions available in each state. The robot's movement is stochastic, and the transition probabilities and rewards are defined in the above tables.
Apply the value iteration algorithm for 3 iterations and use a discount factor . Show utility values at each iteration. After the third iteration, determine the optimal action to take at each state. Round all utility values to two decimal places at each iteration step. Show all intermediate calculations used to compute the expected utility for each action in every state at each iteration. [9]
MDPs and Reinforcement Learning
4 (b) In the previous question, you applied the Bellman equation for value iteration. Now, briefly explain how this equation is modified in Q-learning, and identify two key differences between value iteration and Q-learning in terms of: Use of the transition model and Type of value being learned. Also, state how each algorithm is typically applied in model-based and model-free settings, giving one example application for each. [5]
MDPs and Reinforcement Learning
Question 5
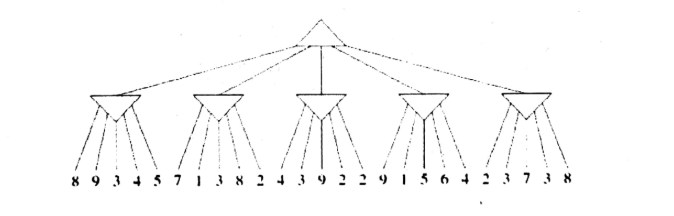
5 (a) Give a detailed description of the minimax algorithm for two-player games, illustrating your answer using the following game tree. [7]
Minimax and Alpha-Beta Pruning
5 (b) Give a detailed description of the technique of alpha-beta pruning, again illustrating your answer using the game tree above. [7]
Minimax and Alpha-Beta Pruning
Question 6
6 (a) A certain disease affects 1% of the population. There is a test for the disease that is 99% accurate for those who have the disease (true positive rate) and 95% accurate for those who do not have the disease (true negative rate). [3]
Considering the above, define the following:
- : Probability of having the disease.
- : Probability of not having the disease.
- : Probability of a positive test given that the person has the disease.
- : Probability of a positive test given that the person does not have the disease.
Now, use the Bayes theorem to calculate the probability of actually having the disease given a positive test result. Then, calculate the probability of not having the disease given a negative test result.
6 (b) Consider a Hidden Markov Model (HMM) with the following state transition probability matrix and Emission Matrix. [2+2+3+4]
| A | B | C | |
|---|---|---|---|
| A | 0.6 | 0.2 | 0.2 |
| B | 0.3 | 0.5 | 0.2 |
| C | 0.1 | 0.3 | 0.6 |
| X | Y | |
|---|---|---|
| A | 0.8 | 0.2 |
| B | 0.5 | 0.5 |
| C | 0.3 | 0.7 |
i. Draw the graphical formulation of HMM considering the above information while mentioning each of the associated HMM tuples. ii. Given the initial distribution , explain what each of these values represents. Discuss the role of in an HMM and how it can influence the outcome of the model. iii. Explain the key difference between a Markov Chain and a Hidden Markov Model (HMM), particularly in terms of observability of states. Then, discuss the impact of the Markov property in both settings. iv. In the context of Hidden Markov Models (HMM), three fundamental problems are crucial for effective use. Describe each of these problems, including their purposes, the terms involved, and finally, mention the name of at least one algorithm that is commonly used to solve them.
Markov Chains and Hidden Markov Models
Question 7
7 (a) During a machine learning workshop, a student was training a neural network. He started with the Sigmoid activation function but soon noticed that his model was learning very slowly, especially in the earlier layers of the network. Hoping to improve training, he switched to a different activation function. This time, training speed improved significantly, but after a few epochs, he observed that several neurons had completely stopped producing any meaningful output — they always returned zero, no matter the input. Rafi tried yet another variation of the activation function and finally managed to keep all neurons active while maintaining stable learning throughout the network. [9]
Based on this scenario, explain what might have caused the learning to slow down initially and why some neurons later stopped updating altogether. Propose what kind of activation function the student might have used at each stage and justify your reasoning. In your explanation, draw and label the graphs of each activation function and their derivatives, and discuss how the gradient behavior impacts the learning process.
Overview of Artificial Intelligence
7 (b) A neural network trained to classify images into three categories — Car (Class 0), Bike (Class 1), and Bus (Class 2) — produces the following logits for a test input: [0.2, 2.5, 0.3]. The true class label for this input is Car (Class 0). Using this information, compute the Softmax probabilities for each class (rounded to three decimal places), represent the true label as a one-hot encoded vector, and calculate the cross-entropy loss using the predicted probabilities and the true label (using natural logarithm and rounded to three decimal places). Finally, explain what the loss value indicates about the model's prediction and confidence. [5]
Overview of Artificial Intelligence